


You’ve probably heard a lot about “AI SEO” lately.
It’s all the buzz in the online marketing world, with everybody trying to figure out how to make their pages appear in AI results. That’s definitely worth exploring but you need to ask yourself something else first.
How can you improve your pages for AI search results if you don’t even have a way to measure how much traffic you’re getting right now?
Recently, we were on a call with one of our clients and noticed that our articles were appearing in Google search results as well as AI chatbot recommendations. But we had no way of knowing if any of those results were actually driving clicks and traffic to our client’s website!
They asked us for help, so I went and set up tracking. Turns out you can easily do it for free. You just need:
- A Google Analytics account
- Website with GA tracking code installed
- Basic familiarity with the Google Analytics interface
The setup worked brilliantly for our client, so I decided to write this guide to share with any of our other clients who want to set this up themselves. But I realized this is a useful resource for anyone, so we’re publishing it.
So let’s start.
Step 1: Google Analytics
For this, you’ll need to use Google Analytics, which I know is considered alien technology to most marketers — It’s a lot to take in. But I swear this will be very fast and easy.
If you haven’t already, here’s a guide to connect Google Analytics with your domain: https://support.google.com/analytics/answer/9304153?hl=en
Once this is done, everything is set for you to create AI tracking!
First, in GA’s left menu panel, you’ll find an option called “Explore.” It’s the one with the “up arrow in a circle” symbol.
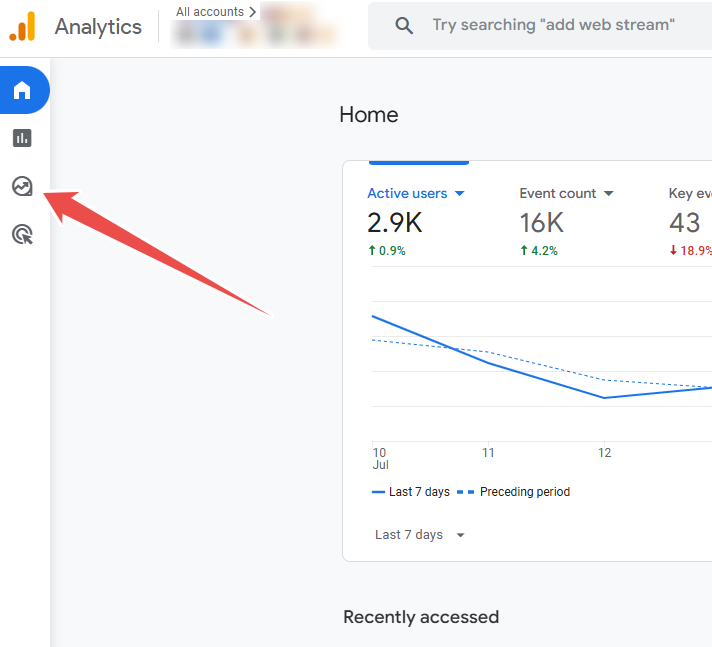
Click on that and you’ll land on the explorations screen.
Click on “Blank” under “Start a new exploration.”
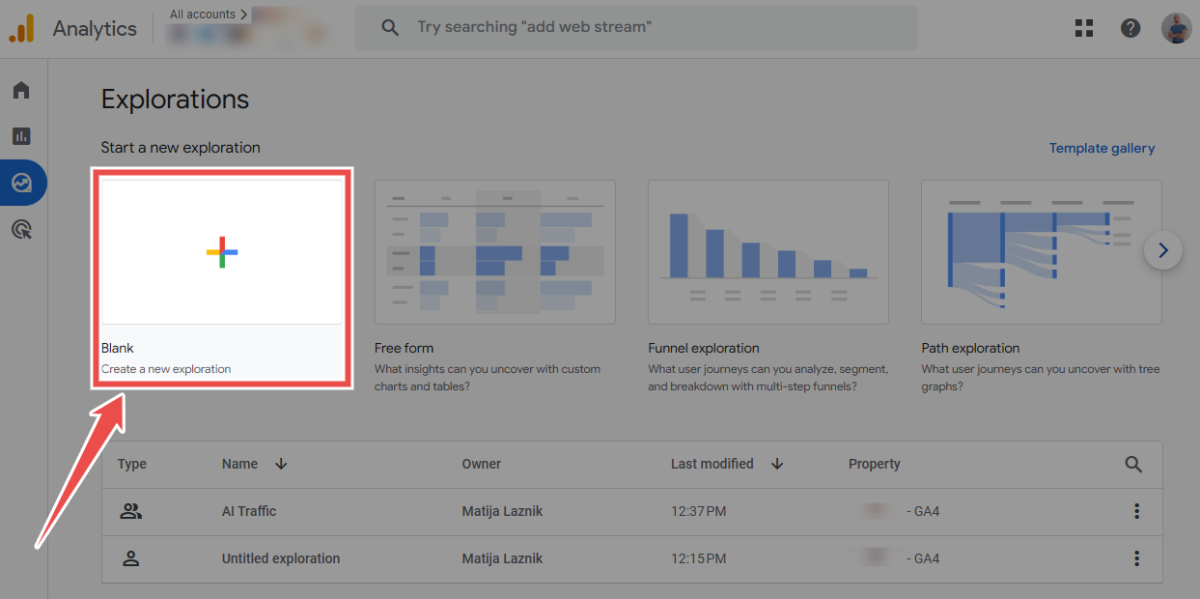
You’re now where you need to be to set it up. This is also where you’ll be able to find your explorations going forward.
Step 2: The Setup
Now that you’re in the exploration setup screen, I’ll first give you a quick overview of what all the widgets are.
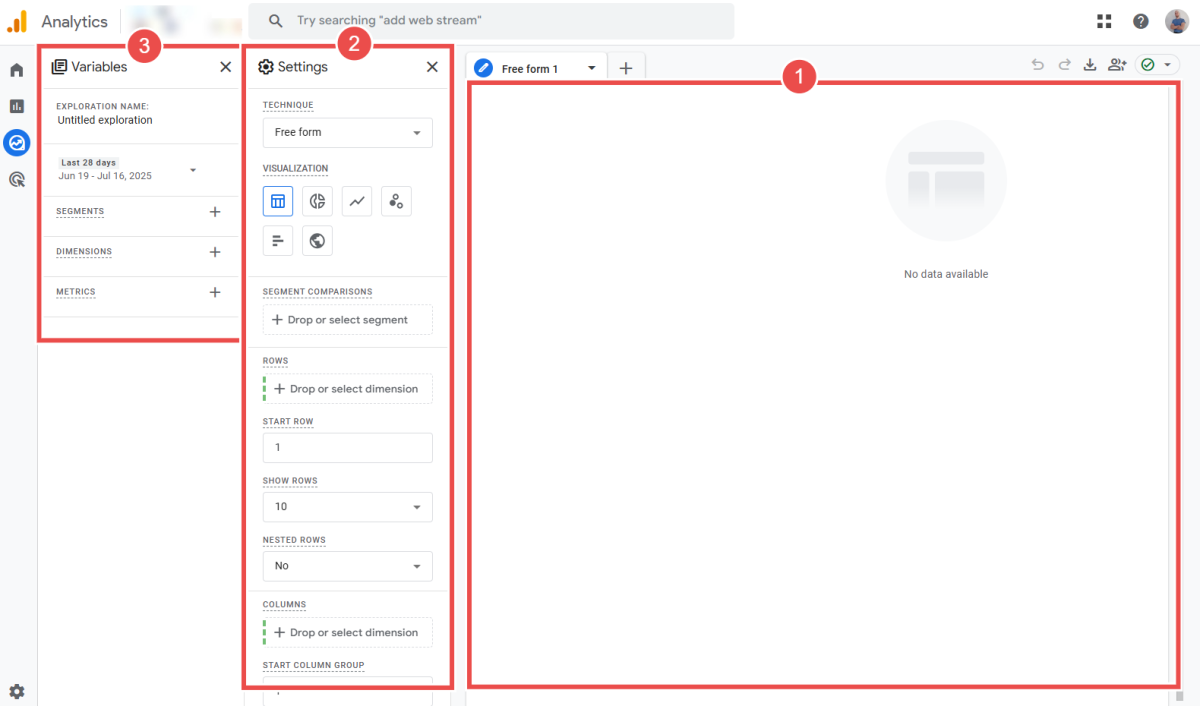
The blank page on the right is where you’ll see the data visualized once we set everything up (1). You can ignore that panel for now. To the left of that, in the middle, you’ll see the “Settings” panel (2). That’s where we can set up our visualizations once we have the data sources selected. But first, we need to set up our sources. That’s what the left-most panel, called “Variables,” is all about (3). We’ll start with that one.
First, going top to bottom in the Variables panel, let’s give this exploration a name — something like “AI traffic exploration.”
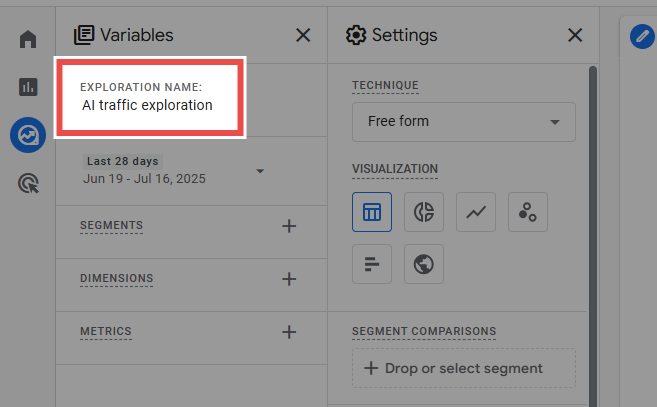
Then, we can leave the date range set to “28 days” for now — feel free to play around with this once we have everything set up.
Next, we’ll ignore the “Segments” option and go set up “Dimensions.”
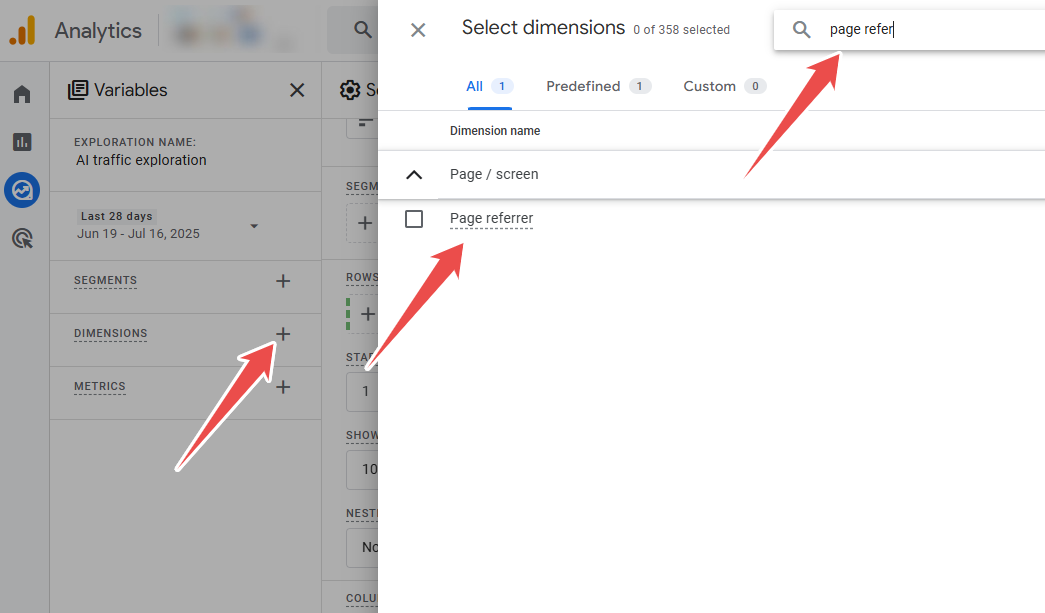
Click on the “+” next to “Dimensions” and a side panel will open. Ignore everything but the search bar at the top. Search for and select “Page referrer” (this tells us where the traffic is coming from) and “Landing page” (this tells us where the traffic is going to). That’s done.
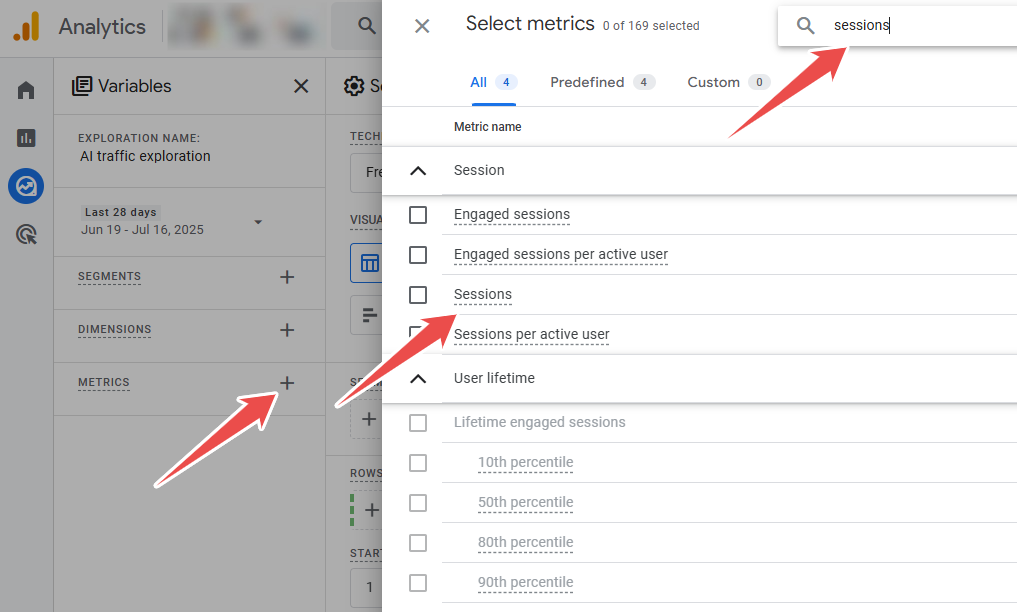
Now, press the “+” next to the “Metrics” option so another side panel opens. In this one, you need to search for and select “Sessions.”
That’s it for the Variables panel. Next, we’ll move on to Settings.
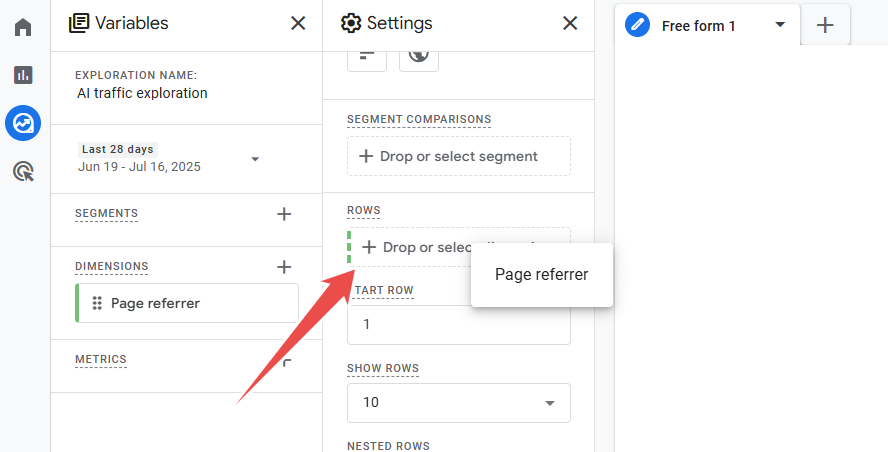
We’ll ignore most of the settings here for now — just find “Rows” first. Under “Rows,” you’ll click on the “+ Drop or select dimension” option and select “Page referrer.” Leave everything else under “Rows” as is.
Next, scroll down to “Values,” click on “+ Drop or select metric,” and select “Sessions.” At this point, a chart will appear in the right-most panel but this isn’t it yet!
What you see there is all the traffic that Google Analytics is tracking from every source (you only see the top 10).
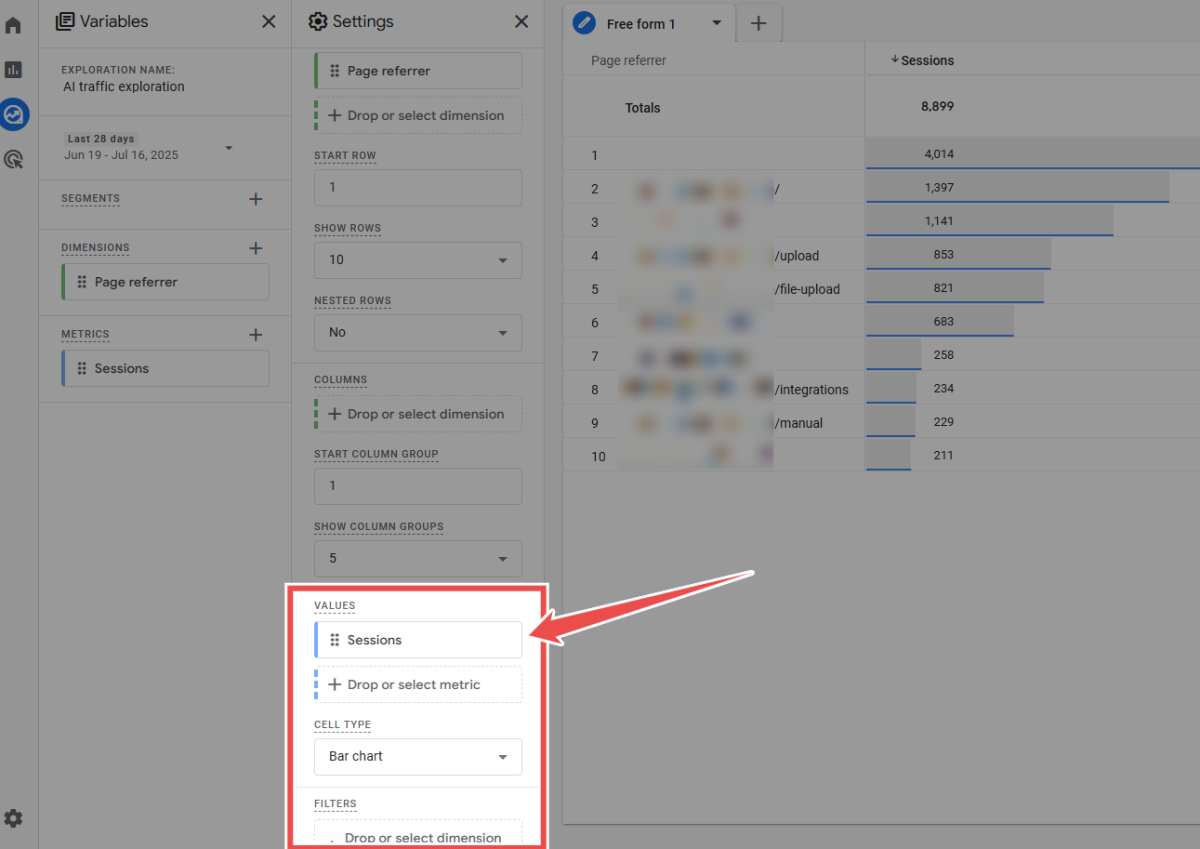
That’s not what we’re after, so for our final step, scroll right to the bottom of the “Settings” panel and find “Filters.”
Here, you’ll click on “+ Drop or select dimension or metric” and select “Page referrer.”
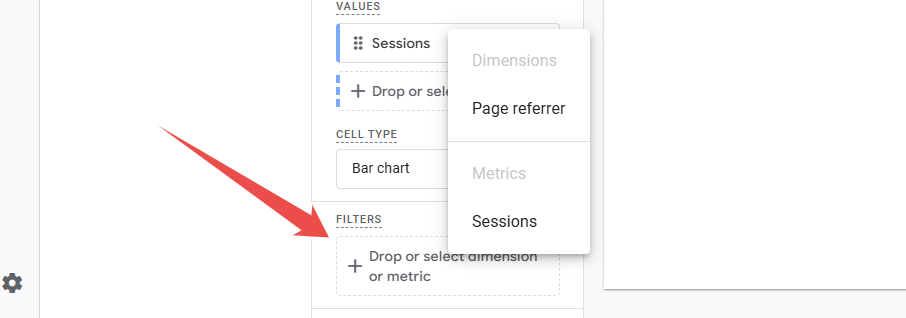
Now, a new tab with a few options will appear under “Filters.” In this tab, you’ll see “Conditions” and a dropdown titled “Select match type.” Click that and select “matches regex,” then below the dropdown, in the “Enter expression” option, paste this regex query:
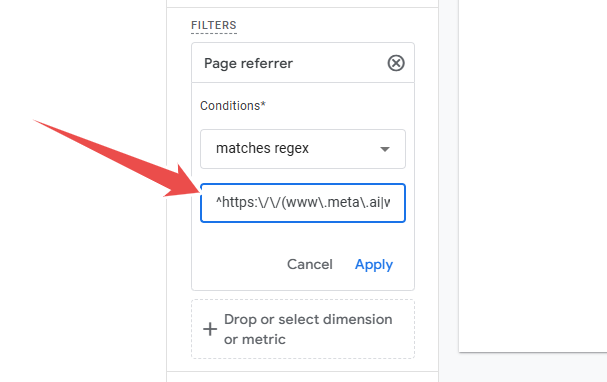
This query will filter out every page referrer other than the popular LLM chatbots:
- Meta AI
- Perplexity
- ChatGPT
- Claude
- Mistral
- Gemini
- Bard
- Microsoft Copilot
Keep in mind, this is only for LLM chatbot traffic — you can’t track Google AI Overviews and AI Mode traffic. I researched this and found that it’s not possible to isolate that traffic yet. It’s automatically counted towards your traffic in Google Search Console performance data.
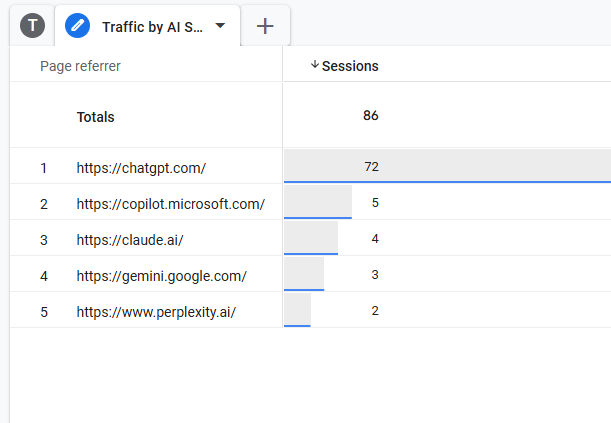
Now, in the right panel, you’ll see which chatbot is referring traffic to you and how much (over the past 28 days).
Step 3: What Else Can You Do With This?
In the current setup, you can only see which chatbot is referring traffic and how much traffic is being referred from each.
But what if you want to see how much AI traffic each of your pages are getting?
That’s where the “Landing page” dimension we selected earlier comes in.
If you go back up to the “Rows” option under “Settings,” you’ll see that you can add another dimension. Try adding “Landing page” and drag & drop it above “Page referrer.” This will show you how much traffic each page is getting and where that traffic is coming from.
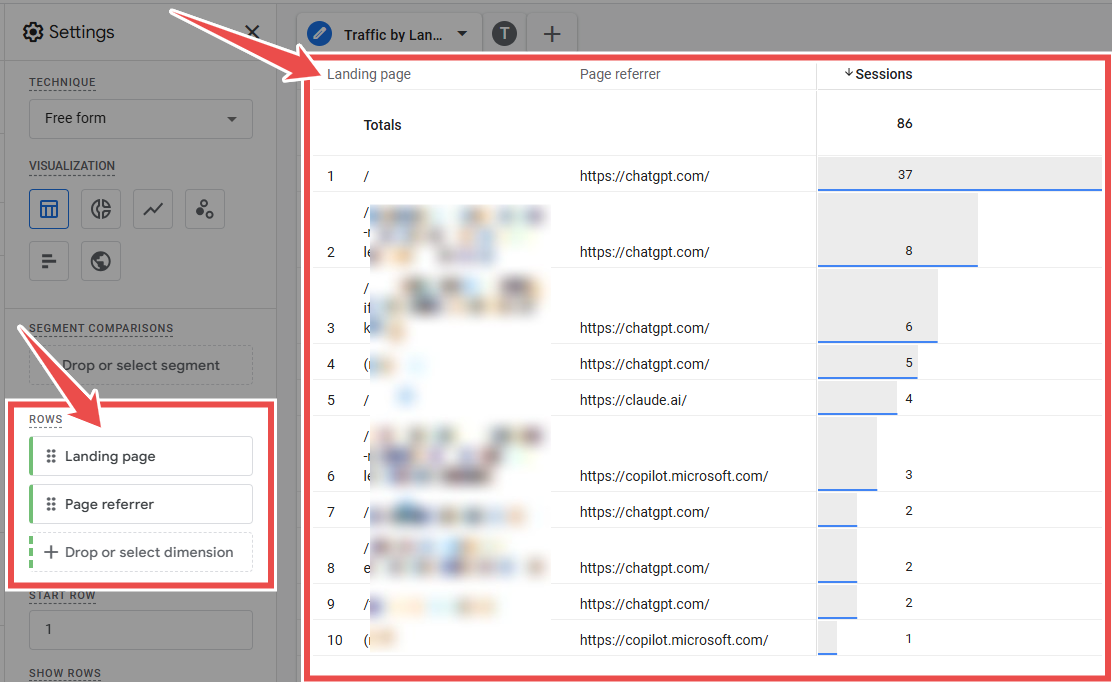
I suggest you set up these two basic reports and then experiment with mixing and matching different dimensions and metrics to get more insights!
Final Thoughts
That’s it!
You now know how to track the AI traffic coming to your webpage. And you did it with one of the most convoluted platforms known to marketers — Google Analytics!
Congrats!